Dataset Refresh History Enhancements


Refreshes are the heartbeat of your Power BI reports, ensuring that your data is current and insights are timely. However, we understand that sometimes refreshes might not go as planned. That’s why we’ve enhanced the dataset Refresh History page to help you diagnose and resolve issues more effectively.
Now, right from the Refresh History page, and for each dataset refresh (including successful ones), you can visualize essential details about the refresh operation. This information could swiftly explain why a refresh took longer than expected, eliminating the need for further time-consuming deep-dive analysis.
Automatic Refresh Attempts Tracking
When you refresh your dataset (e.g. using schedule refresh), Power BI automatically makes multiple attempts to refresh a dataset if it experiences a refresh failure. Without insight into refresh history activities, it may just seem like a refresh is taking longer than expected and generated more database queries than you would expect.
You can now visualize all the refresh attempts and gain insight into the reason for the failure or unusual duration:
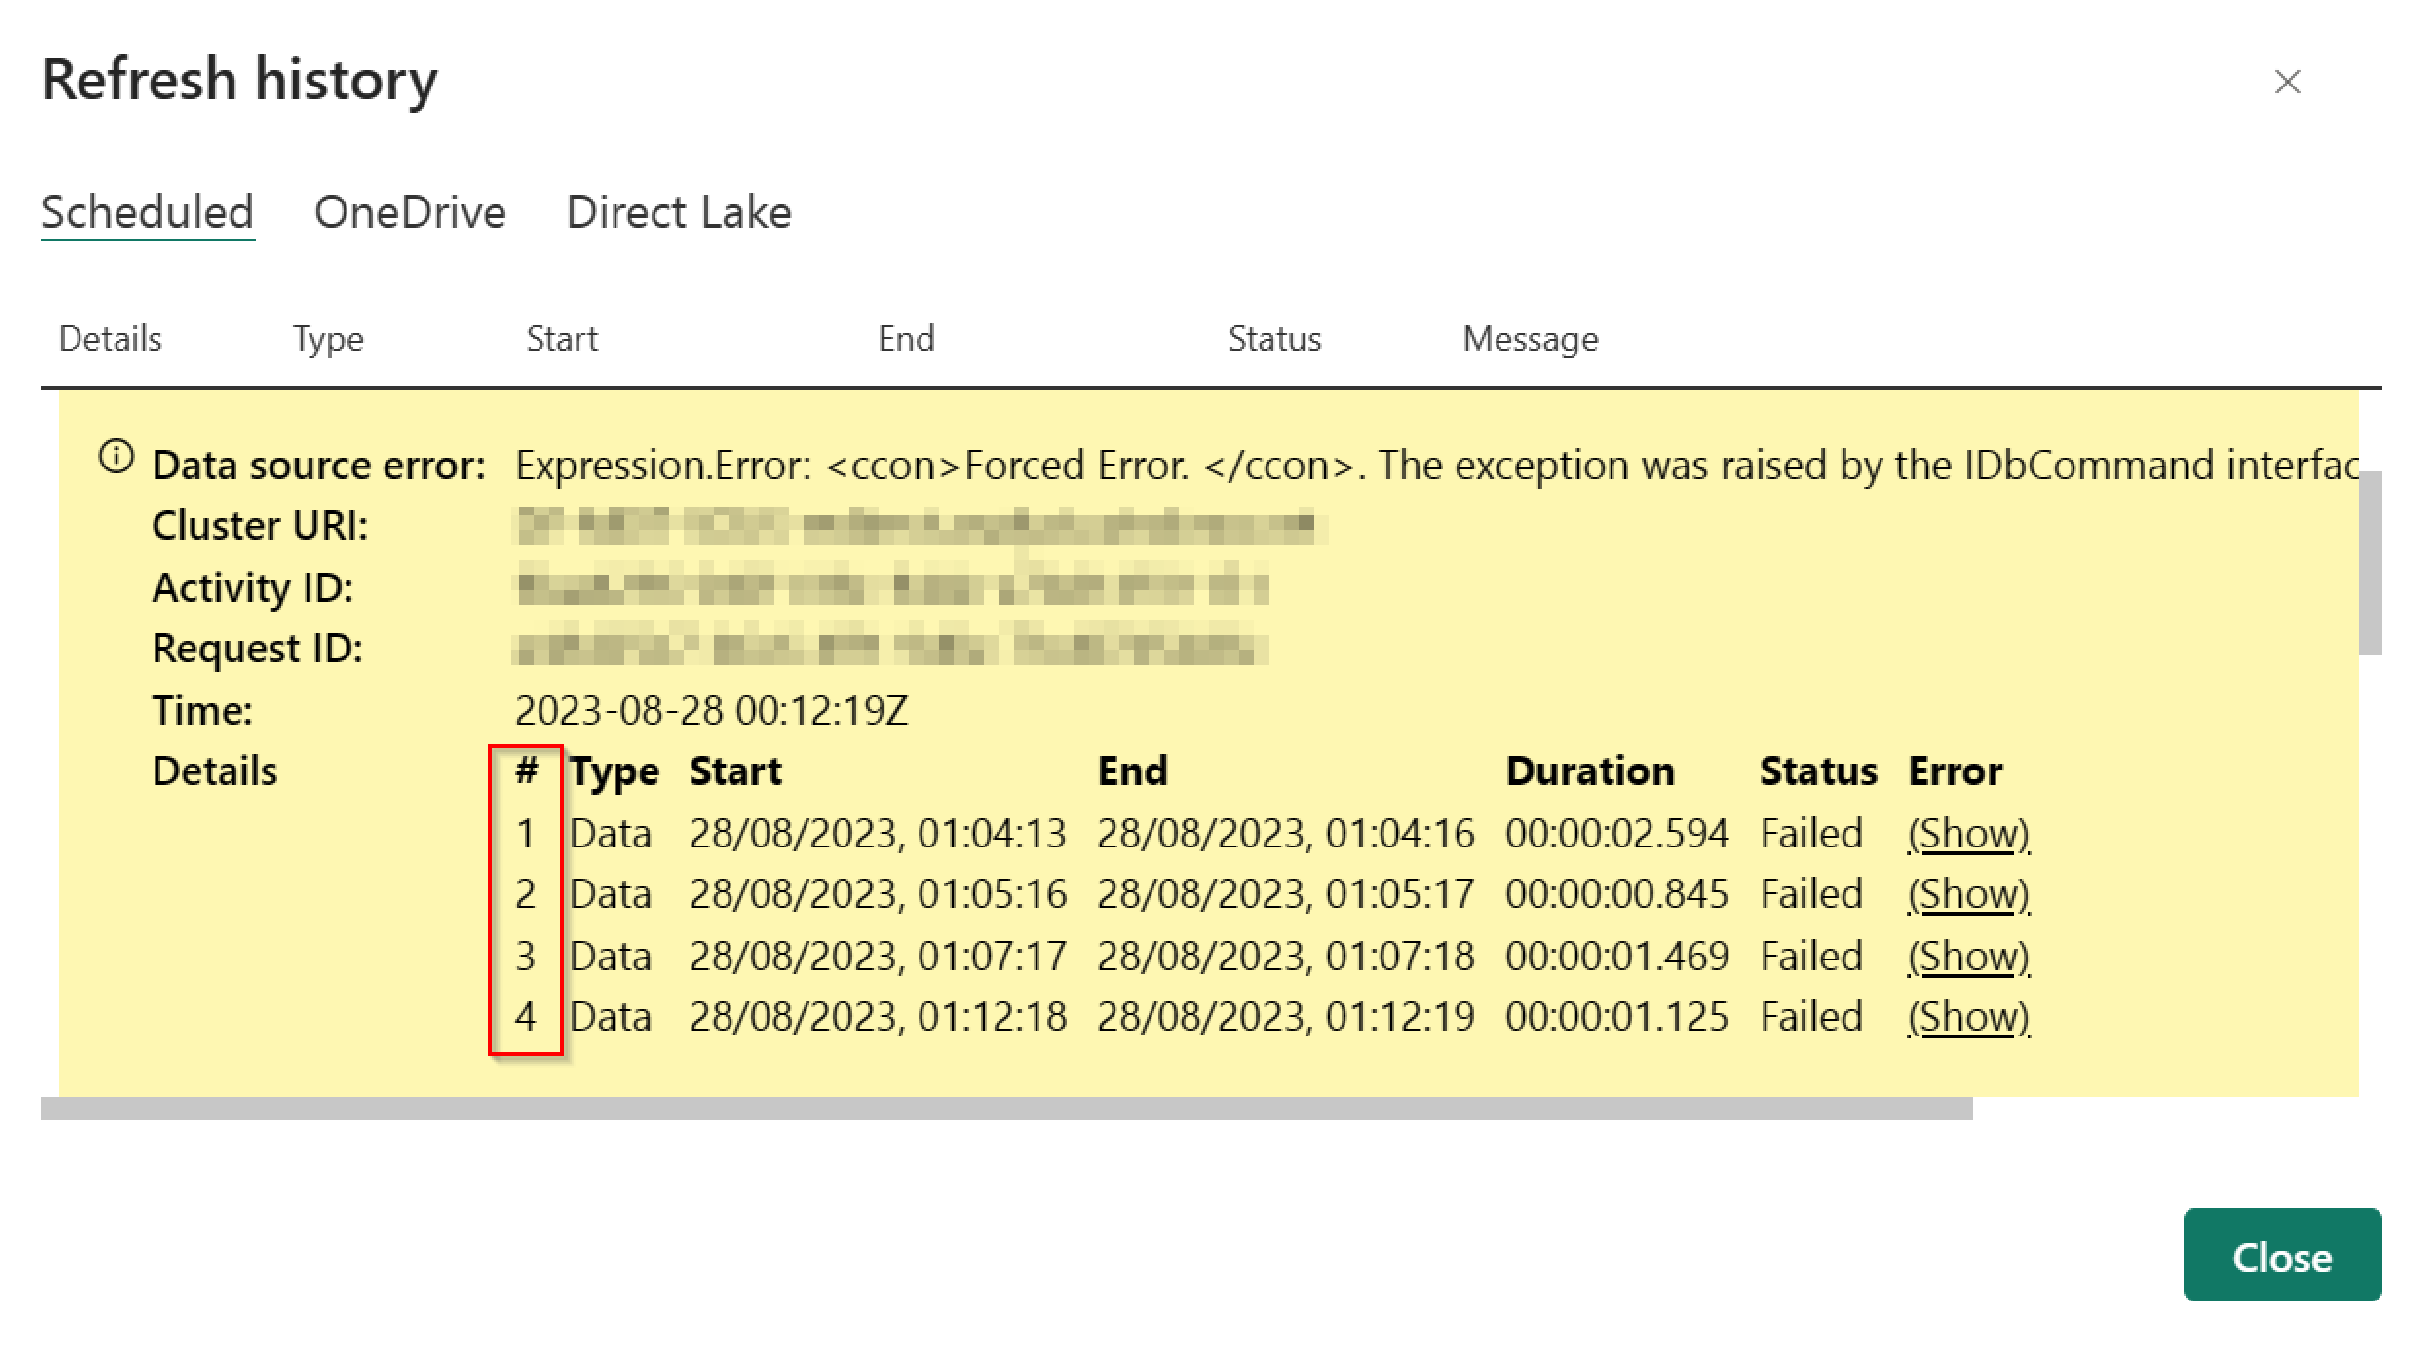
This information is relevant not only when the refresh fails but also when it succeeds. Consider the following example: the refresh was completed successfully, but it took longer than expected. The reason behind this delay was that it only succeeded after three previous failures.
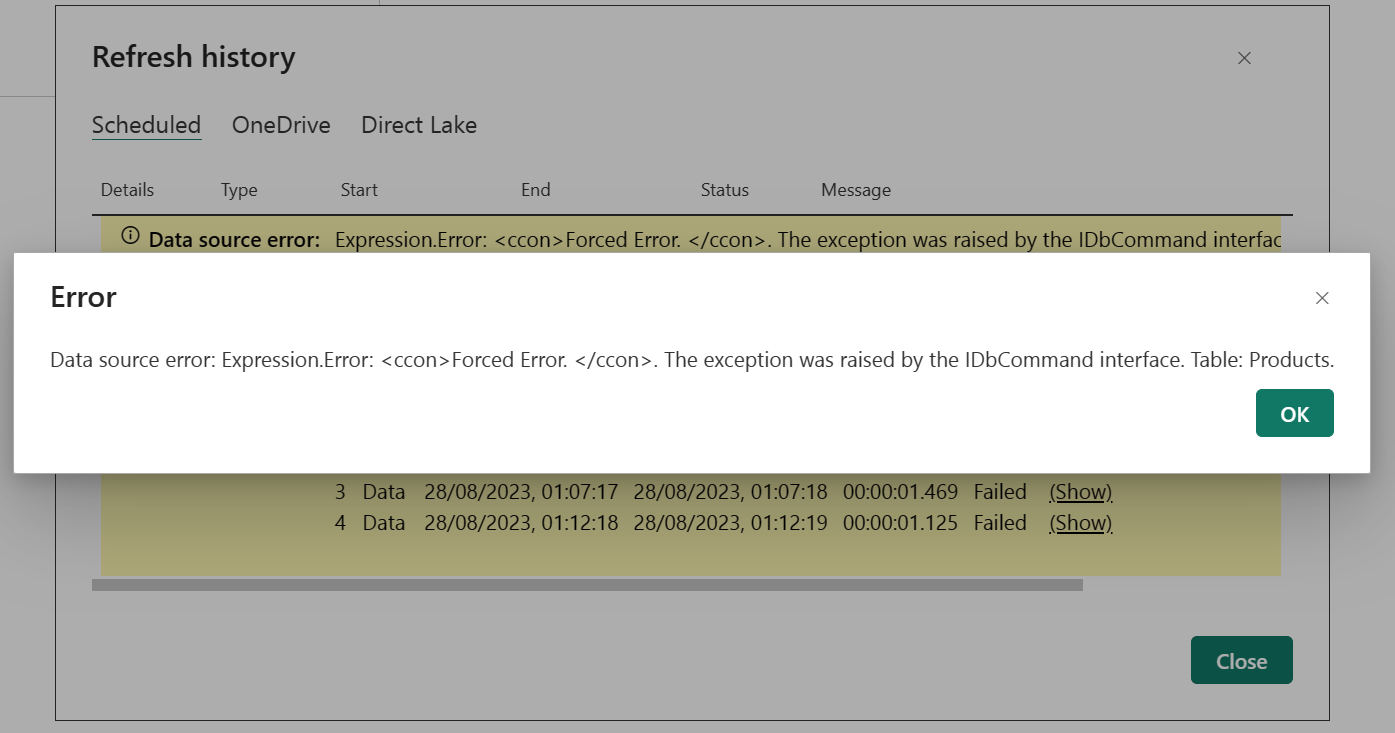
To access additional information about the error for each attempt, simply click on the “(Show)” link within the row of any failed attempt:
Refresh Attempt Details
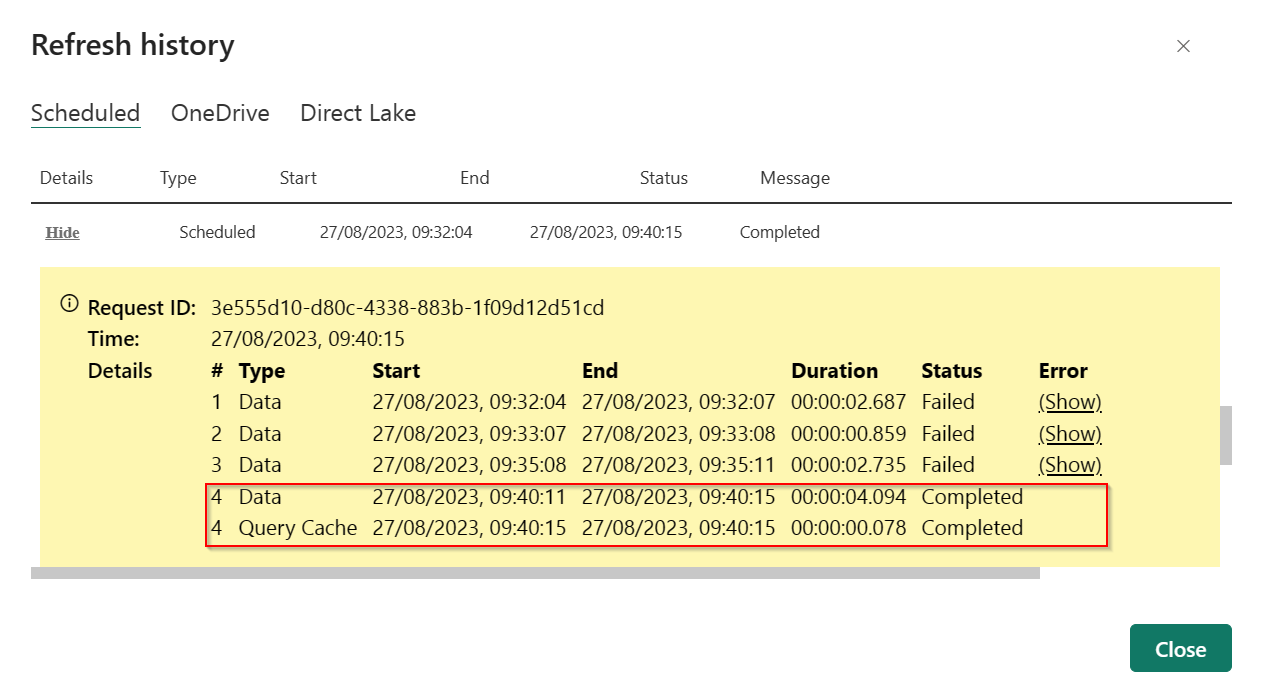
A Power BI dataset refresh operation can involve multiple refresh types and steps, including data refresh, OneDrive refresh, the refreshing of query caches, and dashboard tile refresh, all based on the dataset’s type (learn more about refresh types here).
Each refresh attempt is divided into two operations:
- Data – Load data into the dataset
- Query Cache – Premium Query Caches and/or Dashboard Tiles refresh
You can view those operations for each refresh attempt, grouped under the same index (#):
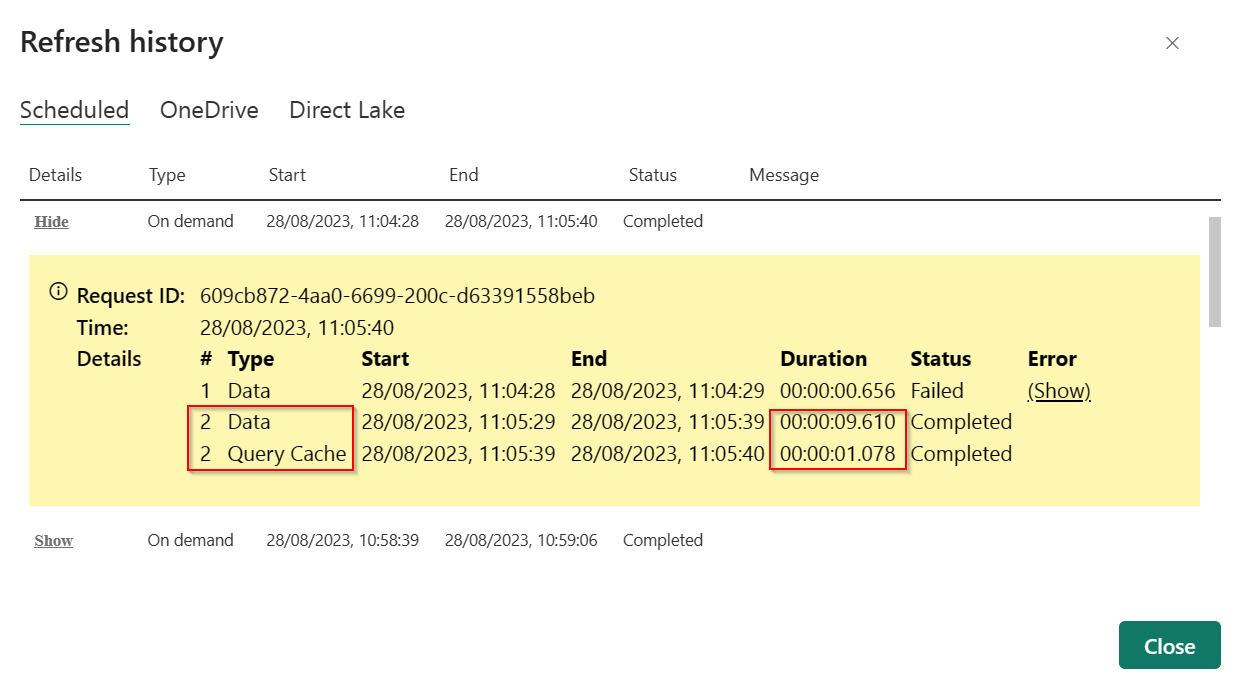
Excessive use of dashboard tiles and/or premium caching can significantly increase the overall refresh duration, as it may queue a high number of queries after each refresh. With this information, you can quickly diagnose whether this is the case and take action to optimize. You can either reduce the number of dashboards or disable the automatic cache refresh setting in the workspace to help reduce the number of cache related queries.
The data and query cache phases are independent of each other, but run in sequence. If the “Data” phase completes, the data will already be up to date, and users will be seeing fresh data, even if the “Query Cache” fails or takes additional time.
Things to know about
This feature will start lighting up in certain regions as soon as today, but depending on the geography in which your Power BI tenant is located, it may take up to two weeks to appear.
Refreshes made via the enhanced refresh API and/or XMLA Endpoint won’t show attempt details. An update will be coming soon to include those details.
Give it a try
We hope this enhancement greatly improve your dataset refresh troubleshooting, and we look forward to hearing your feedback.

