Exportable Formatted Data Tables (Preview)


We’re pleased to announce that the long-anticipated public preview of our low-code web authoring experience for exportable formatted data tables is now available. You can use the formatted table feature to create paginated reports in any modern workspace, including workspaces that aren’t in a Power BI Premium capacity. For the first time, you will be able to author a simple formatted table in the Power BI service. This experience uses Power BI datasets and will allow you to edit the final output by contrast to the design first, then render approach that Report Builder requires. You can even add styling. When you export data, the styling is preserved. And because a paginated report is created under the covers, the 150000 Excel and 30000 csv row limits do not apply. This is truly a low code modern authoring experience!
Let’s get started
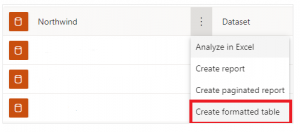
In Data hub view, select More options (…) next to a dataset > Create formatted table.
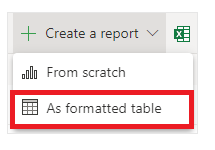
Or if you click on a dataset, Select As formatted table.
The new paginated report online editing experience opens. It’s called formatted table. There are a few panes here to take a look at.
Create a table
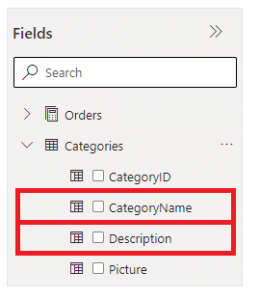
To create your first table, select fields names in the Fields pane on the right. This pane gives you a table-and-column based view of the chosen dataset. When you find a column that you wish to add to your table, select the column or drag it into the pane labelled Build.
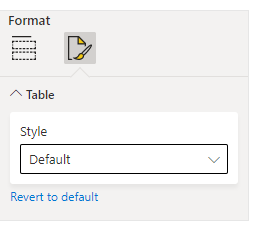
The Build pane has other customization options for you to create a better looking table. To access these options, select the Format tab at the top of the Build pane.
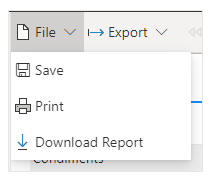
On the File menu, save, download, or print your report.
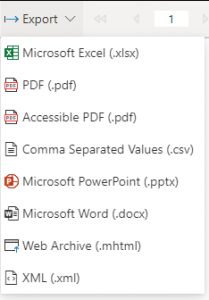
On the Export menu, choose the file format you prefer.
You’ve just created your first paginated report in the Power BI service!
What’s next for formatted tables?
The ability to create formatted tables from data in Power BI visualizations and datasets with the ability to filter the data, resize columns, control fonts and colors and export whole tables of data to Excel, PDF or PowerPoint.
This feature is currently in preview. If you would like to continue the conversation and provide suggestions or feedback, join our panel here. You can be directly involved in new capabilities for the formatted table. Let us know what you think!

