Visualizing SharePoint lists now available to all users
A couple of months ago, we launched a new Power BI integration for visualizing SharePoint lists for all Targeted release users. We’re now excited to announce that the experience has rolled out to Standard release users and is now accessible to everyone!
You can check out this video from the original launch or read on to get a high-level overview of the feature.
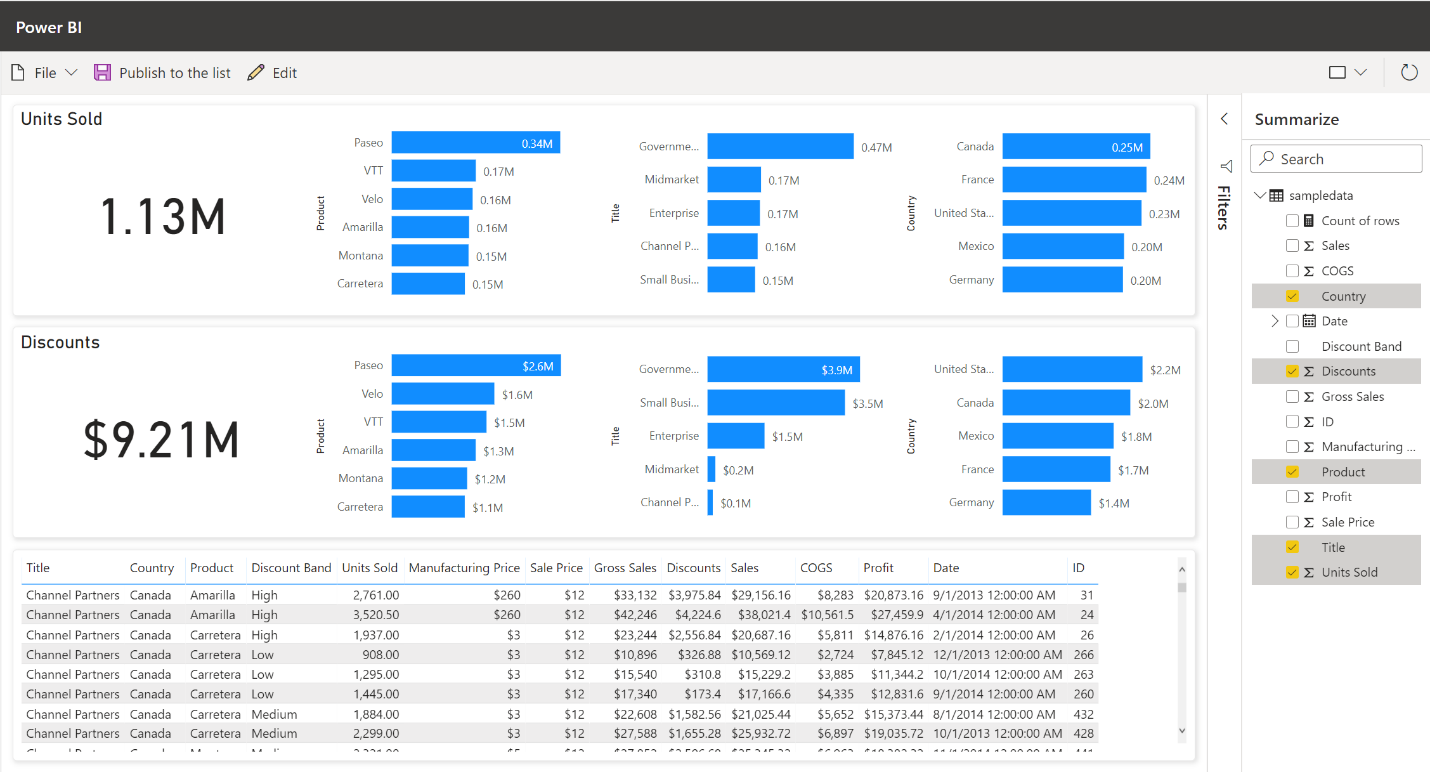
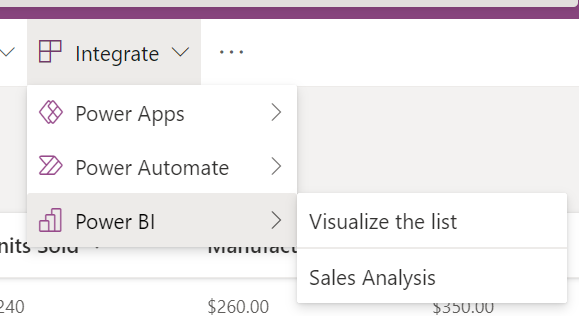
This experience empowers SharePoint list and Microsoft List users to easily explore your data. With just a couple of clicks, you’re able to go from looking at a list of data to interacting with an auto-generated report. You’ll find this new option under the Integration menu on any list.

Once you select Visualize in Power BI, a new tab will open the automatically generated report, which you can then further customize and publish back to the list.

The reports you save and publish back to the list are not visible within the Power BI service. Instead, to make it easy for other list users to find, you’ll find these published reports within the same Integrate menu of the list.

For all the details of the feature, be sure to check out our documentation.
Lastly, if you’re interested in having a report automatically created for you, but you don’t have data within lists, don’t forget you can similarly automatically generate reports within the Power BI service just by copy and pasting data.


